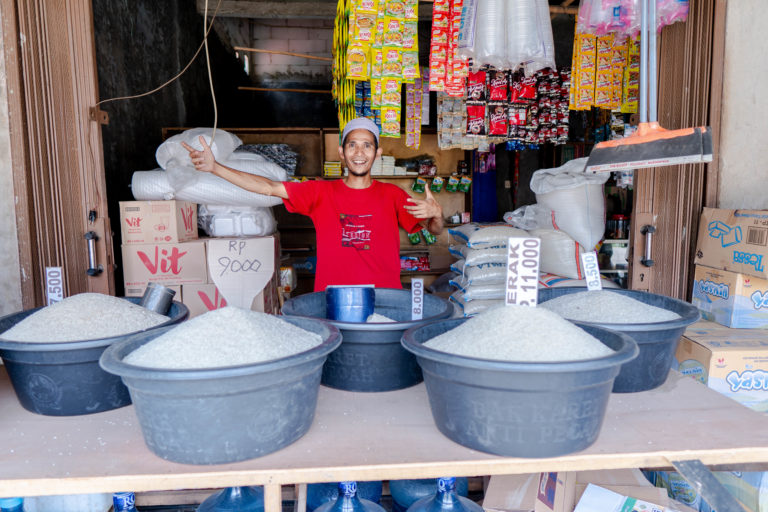
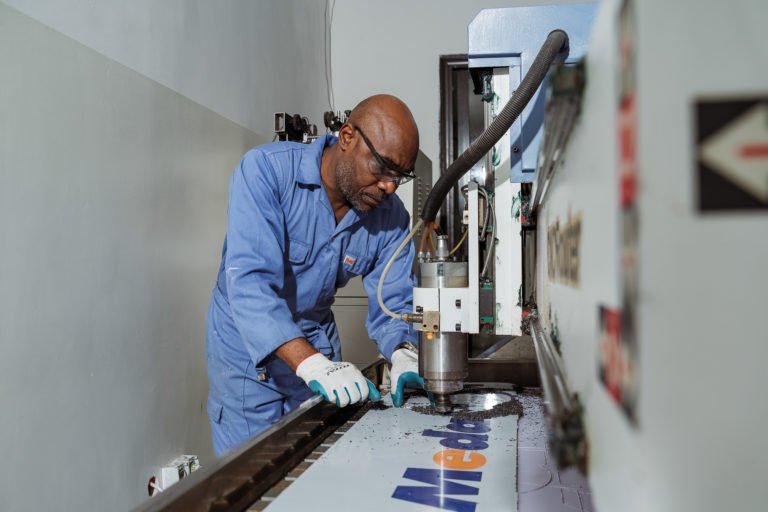
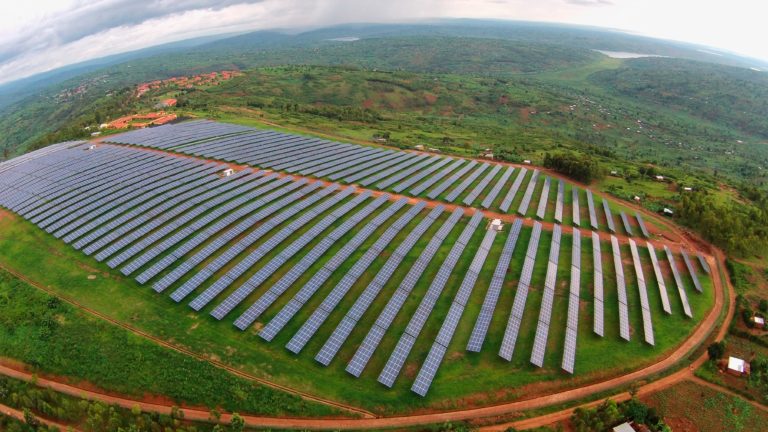
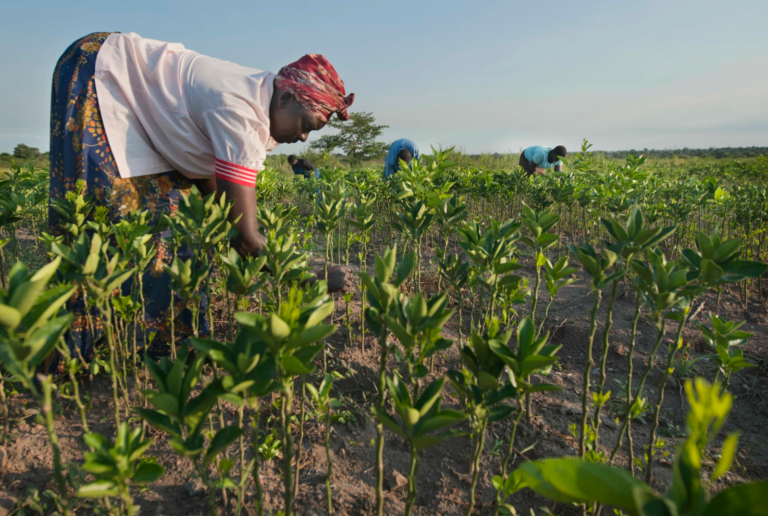
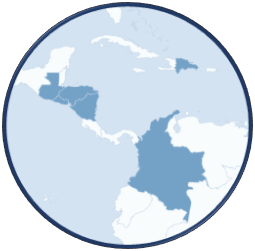
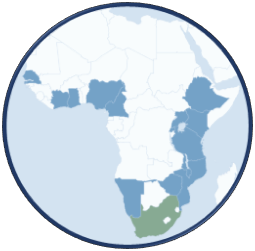
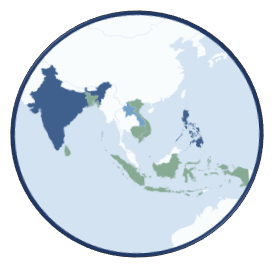
Norfund invests in developing countries to create jobs, improve lives, and support the transition to net zero Norfund – The Norwegian Investment Fund for Developing Countries Our investment areas Renewable Energy Financial Inclusion Scalable Enterprises Green Infrastructure Annual report 2022In 2022, Norfund’s investments contributed to create 24,500 new jobs, with a return of 5.1% IRR. The Norfund Conference 2024The Norfund Conference 2024 takes place on May 23rd in Oslo.Read more here. Our news Norfund matched record for investing in developing countries Norfund with first FinTech equity investment in Indonesian AwanTunai $98.7 million into new fund dedicated to growing African SMEs Norfund exits solar plants in Rwanda and Mozambique Investing in fertilizer based on green hydrogen in Uganda More news Our investment regions Latin America Africa Asia All investments Sign up for our newsletter Name Email*